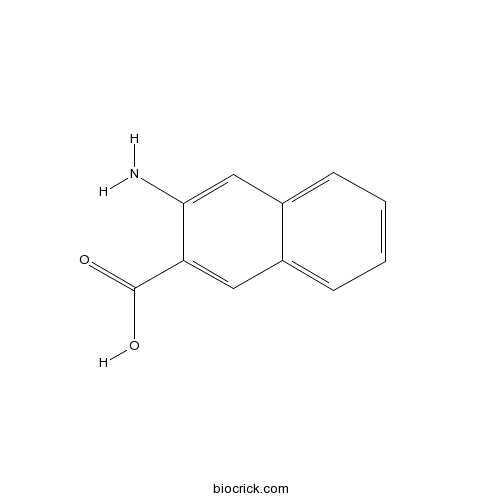
3-Amino-2-naphthoic acidCAS# 5959-52-4 |

Quality Control & MSDS
3D structure
Package In Stock
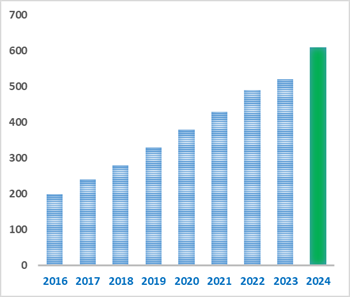
Number of papers citing our products

| Cas No. | 5959-52-4 | SDF | Download SDF |
| PubChem ID | 22244 | Appearance | Powder |
| Formula | C11H9NO2 | M.Wt | 187 |
| Type of Compound | N/A | Storage | Desiccate at -20°C |
| Solubility | Soluble in Chloroform,Dichloromethane,Ethyl Acetate,DMSO,Acetone,etc. | ||
| Chemical Name | 3-aminonaphthalene-2-carboxylic acid | ||
| SMILES | C1=CC=C2C=C(C(=CC2=C1)C(=O)O)N | ||
| Standard InChIKey | XFXOLBNQYFRSLQ-UHFFFAOYSA-N | ||
| Standard InChI | InChI=1S/C11H9NO2/c12-10-6-8-4-2-1-3-7(8)5-9(10)11(13)14/h1-6H,12H2,(H,13,14) | ||
| General tips | For obtaining a higher solubility , please warm the tube at 37 ℃ and shake it in the ultrasonic bath for a while.Stock solution can be stored below -20℃ for several months. We recommend that you prepare and use the solution on the same day. However, if the test schedule requires, the stock solutions can be prepared in advance, and the stock solution must be sealed and stored below -20℃. In general, the stock solution can be kept for several months. Before use, we recommend that you leave the vial at room temperature for at least an hour before opening it. |
||
| About Packaging | 1. The packaging of the product may be reversed during transportation, cause the high purity compounds to adhere to the neck or cap of the vial.Take the vail out of its packaging and shake gently until the compounds fall to the bottom of the vial. 2. For liquid products, please centrifuge at 500xg to gather the liquid to the bottom of the vial. 3. Try to avoid loss or contamination during the experiment. |
||
| Shipping Condition | Packaging according to customer requirements(5mg, 10mg, 20mg and more). Ship via FedEx, DHL, UPS, EMS or other couriers with RT, or blue ice upon request. | ||

3-Amino-2-naphthoic acid Dilution Calculator

3-Amino-2-naphthoic acid Molarity Calculator
| 1 mg | 5 mg | 10 mg | 20 mg | 25 mg | |
| 1 mM | 5.3476 mL | 26.738 mL | 53.4759 mL | 106.9519 mL | 133.6898 mL |
| 5 mM | 1.0695 mL | 5.3476 mL | 10.6952 mL | 21.3904 mL | 26.738 mL |
| 10 mM | 0.5348 mL | 2.6738 mL | 5.3476 mL | 10.6952 mL | 13.369 mL |
| 50 mM | 0.107 mL | 0.5348 mL | 1.0695 mL | 2.139 mL | 2.6738 mL |
| 100 mM | 0.0535 mL | 0.2674 mL | 0.5348 mL | 1.0695 mL | 1.3369 mL |
| * Note: If you are in the process of experiment, it's necessary to make the dilution ratios of the samples. The dilution data above is only for reference. Normally, it's can get a better solubility within lower of Concentrations. | |||||

Calcutta University

University of Minnesota

University of Maryland School of Medicine

University of Illinois at Chicago

The Ohio State University

University of Zurich

Harvard University

Colorado State University

Auburn University

Yale University

Worcester Polytechnic Institute

Washington State University

Stanford University

University of Leipzig

Universidade da Beira Interior

The Institute of Cancer Research

Heidelberg University

University of Amsterdam

University of Auckland

TsingHua University

The University of Michigan

Miami University

DRURY University

Jilin University

Fudan University

Wuhan University

Sun Yat-sen University

Universite de Paris

Deemed University

Auckland University

The University of Tokyo

Korea University
- Carnosol
Catalog No.:BCN1055
CAS No.:5957-80-2
- H-D-Ala-OtBu.HCl
Catalog No.:BCC2849
CAS No.:59531-86-1
- Boc-Ser-OBzl
Catalog No.:BCC3440
CAS No.:59524-02-6
- Megestrol Acetate
Catalog No.:BCC4365
CAS No.:595-33-5
- Soyasapogenol B
Catalog No.:BCN4097
CAS No.:595-15-3
- Calycanthine
Catalog No.:BCN7823
CAS No.:595-05-1
- Testosterone undecanoate
Catalog No.:BCC9173
CAS No.:5949-44-0
- Citric acid monohydrate
Catalog No.:BCN8492
CAS No.:5949-29-1
- Z-D-Glu(OBzl)-OH
Catalog No.:BCC2772
CAS No.:59486-73-6
- Tafamidis
Catalog No.:BCC5268
CAS No.:594839-88-0
- NSC 146109 hydrochloride
Catalog No.:BCC2410
CAS No.:59474-01-0
- Dihydropyrocurzerenone
Catalog No.:BCN8061
CAS No.:59462-26-9
- H-D-Gln-OH
Catalog No.:BCC2920
CAS No.:5959-95-5
- Glycopyrrolate
Catalog No.:BCC4275
CAS No.:596-51-0
- Alpha-Obscurine
Catalog No.:BCN6701
CAS No.:596-55-4
- AC 55649
Catalog No.:BCC7359
CAS No.:59662-49-6
- Calyciphylline A
Catalog No.:BCN4098
CAS No.:596799-30-3
- 3-O-Acetyl-beta-boswellic acid
Catalog No.:BCN2672
CAS No.:5968-70-7
- 6alpha-Hydroxyhispanone
Catalog No.:BCN7416
CAS No.:596814-48-1
- Cephalexin hydrochloride
Catalog No.:BCC4095
CAS No.:59695-59-9
- Piperacillin Sodium
Catalog No.:BCC4704
CAS No.:59703-84-3
- Camostat Mesilate
Catalog No.:BCC4894
CAS No.:59721-29-8
- Citalopram hydrobromide
Catalog No.:BCC7063
CAS No.:59729-32-7
- beta-Amyrin palmitate
Catalog No.:BCN4099
CAS No.:5973-06-8
Beta-cyclodextrin decorated nanostructured SERS substrates facilitate selective detection of endocrine disruptor chemicals.[Pubmed:23261701]
Biosens Bioelectron. 2013 Apr 15;42:632-9.
We demonstrate the selective detection of endocrine disruptor chemicals (EDCs) from river water using surface enhanced Raman scattering (SERS). By means of nanosphere lithography, the SERS substrate was prepared via the initial deposition of a monolayer of silica nanospheres (with diameter of approximately 330 nm) on a silicon substrate as the template. Subsequently, a 180 nm thick layer of silver followed by a 20 nm layer of gold was deposited. This surface was modified with mono-6-deoxy-6-((2-mercaptoethyl)amino)-beta-cyclodextrin (beta-CD) in order to produce a selective capture surface suitable for EDC capture and their detection by means of SERS. We show that EDC model compounds, including 3-Amino-2-naphthoic acid (NAPH), potassium hydrogen phthalate (PHTH) and the EDC beta-estradiol (ESTR), were captured by the beta-CD decorated surface. This surface facilitated SERS detection with limits of detection of 3.0 muM (NAPH), 10 muM (PHTH) and 300 nM (ESTR), all 10-100 times lower than that without the surface modification with beta-CD. Individual and simultaneous detection of NAPH and PHTH from their mixture was achieved as evidenced using the bianalyte Raman technique.
Simultaneous quantification of levetiracetam and gabapentin in plasma by ultra-pressure liquid chromatography coupled with tandem mass spectrometry detection.[Pubmed:21297550]
Ther Drug Monit. 2011 Apr;33(2):209-13.
INTRODUCTION: Gabapentin (Neurontin) and levetiracetam (Keppra) are anticonvulsants with novel structures and suggested therapeutic ranges of 2-10 mg/L and 6-20 mg/L, respectively. Gabapentin is also used extensively to manage neuropathic pain, and for this indication, wherein higher doses are prescribed, plasma concentrations of 15-30 mg/L are typical. OBJECTIVE: Here, we describe a simple rapid assay to support therapeutic drug monitoring of gabapentin and levetiracetam in plasma by ultra-pressure liquid chromatography couples to tandem mass spectrometry (UPLC-MS/MS) detection. METHODS: After the addition of internal standard and protein precipitation of patient plasma with methanol:acetonitrile in a 50:50 ratio, 1 muL of supernatant sample is injected onto an Acquity UPLC HSS T3, 1.8 mum, 2.1 x 50 mm (Waters) column. Elution occurs using a linear gradient of acetonitrile and water, each having 0.1% formic acid added. The column is eluted into a Waters Acquity UPLC TQD, operating in a positive mode to detect gabapentin at transition 172.18 > 154.11, levetiracetam at 171.11 > 126, and internal standard (3-Amino-2-naphthoic acid) at 188.06 > 170. Secondary transitions for each analyte are also monitored for gabapentin at 172.18 > 137.06, levetiracetam at 171.11 > 154, and internal standard at 188.06 > 115. Runtime is 1.5 minutes per injection with baseline resolved chromatographic separation. RESULTS: The analytical measurement ranges were 1-150 mg/L for gabapentin and for levetiracetam. Intra-assay imprecision by the coefficient of variance (CV) was less than 8% and interassay CV was less than 5% for both analytes, at 4 different concentrations. Results obtained from patient samples were compared with results generated by established high-performance liquid chromatography-UV methods with the following regression statistics: y = 1.12x - 0.77, r = 0.996, Sy, x = 0.89, and n = 29 for gabapentin and y = 0.991x + 0.70, r = 0.997, Sy, x = 2.24, and n = 30 for levetiracetam. No analytical interferences were identified. CONCLUSION: : In summary, a simple reliable UPLC-MS/MS method was developed and validated for routine clinical monitoring of gabapentin and levetiracetam.
Direct formation of ring-fused 1,3-thiazine-2,4-dithiones from aromatic o-amino carboxylic acids: observation of a carbon disulfide mediated thionation.[Pubmed:20666472]
Org Lett. 2010 Aug 20;12(16):3662-5.
A facile synthesis of 2H-3,1-benzothiazine-2,4(1H)-dithiones (trithioisatoic anhydrides) or 2H-naphtho[2,3-d][1,3]thiazine-2,4(1H)-dithione solely from anthranilic acids or 3-Amino-2-naphthoic acid and carbon disulfide, performed at room temperature in 1,4-dioxane in the presence of Et(3)N, is reported. Corresponding 2-alkylsulfanyl derivatives were obtained in one-pot reactions under the same conditions after addition of alkyl halides. The mechanism of the thiazine cyclization was investigated using (13)C-labeled carbon disulfide to reveal that carbon disulfide was incorporated into the heterocycle and additionally acted as a thionation reagent.
A metabonomic investigation of the biochemical effects of mercuric chloride in the rat using 1H NMR and HPLC-TOF/MS: time dependent changes in the urinary profile of endogenous metabolites as a result of nephrotoxicity.[Pubmed:15152332]
Analyst. 2004 Jun;129(6):535-41.
The effects of the administration of a single dose of the model nephrotoxin mercuric chloride (2.0 mg kg(-1), subcutaneous) to male Wistar-derived rats on the urinary metabolite profiles of a range of endogenous metabolites has been investigated using (1)H NMR and HPLC-MS. Urine samples were collected daily for 9 days from both dosed and control animals. Analysis of these samples revealed marked changes in the pattern of endogenous metabolites as a result of HgCl(2) toxicity. Peak disturbances in the urinary metabolite profiles were observed (using both NMR and HPLC-MS) at 3 days post dose. Thereafter the urinary metabolite profile gradually returned to a more normal composition. Markers of toxicity identified by (1)H NMR spectroscopy were raised concentrations of lactate, alanine, acetate, succinate, trimethylamine (TMA), and glucose. Reductions in the urinary excretion of citrate and alpha-ketoglutarate were also seen. Markers identified by HPLC-MS, in positive ion mode, were kynurenic acid, xanthurenic acid, pantothenic acid and 7-methylguanine which decreased after dosing. In addition an ion at m/z 188, probably 3-Amino-2-naphthoic acid, was observed to increase after dosing. As well as these identified compounds other ions at m/z 297 and 267 decreased after dosing. In negative ion mode a range of sulfated compounds were observed, including phenol sulfate and benzene diol sulfate, which decreased after dosing. As well as the sulfated components an unidentified glucuronide at m/z 326 was also observed to decrease after dosing. The results of this study demonstrate the complementary nature of the NMR and MS-based techniques for metabonomic analysis.


