UreaCAS# 57-13-6 |
- MK-4827 tosylate
Catalog No.:BCC4174
CAS No.:1038915-73-9
- MK-4827 Racemate
Catalog No.:BCC5179
CAS No.:1038915-75-1
- BYK 204165
Catalog No.:BCC2449
CAS No.:1104546-89-5
- EB 47
Catalog No.:BCC2452
CAS No.:1190332-25-2
- BMN-673 8R,9S
Catalog No.:BCC1422
CAS No.:1207456-00-5
- A-966492
Catalog No.:BCC2211
CAS No.:934162-61-5
Quality Control & MSDS
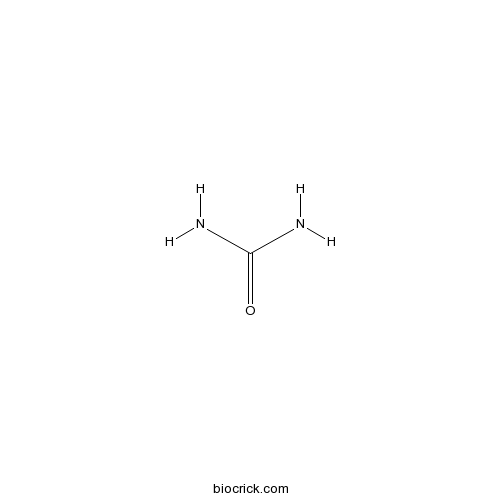
3D structure
Package In Stock
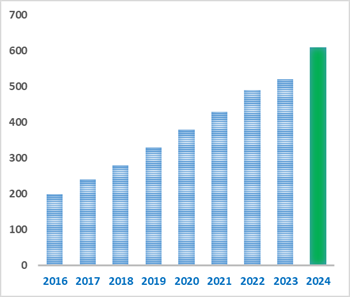
Number of papers citing our products
| Cas No. | 57-13-6 | SDF | Download SDF |
| PubChem ID | 1176 | Appearance | Powder |
| Formula | CH4N2O | M.Wt | 60.06 |
| Type of Compound | N/A | Storage | Desiccate at -20°C |
| Solubility | >6mg/ml in DMSO | ||
| Chemical Name | urea | ||
| SMILES | C(=O)(N)N | ||
| Standard InChIKey | XSQUKJJJFZCRTK-UHFFFAOYSA-N | ||
| Standard InChI | InChI=1S/CH4N2O/c2-1(3)4/h(H4,2,3,4) | ||
| General tips | For obtaining a higher solubility , please warm the tube at 37 ℃ and shake it in the ultrasonic bath for a while.Stock solution can be stored below -20℃ for several months. We recommend that you prepare and use the solution on the same day. However, if the test schedule requires, the stock solutions can be prepared in advance, and the stock solution must be sealed and stored below -20℃. In general, the stock solution can be kept for several months. Before use, we recommend that you leave the vial at room temperature for at least an hour before opening it. |
||
| About Packaging | 1. The packaging of the product may be reversed during transportation, cause the high purity compounds to adhere to the neck or cap of the vial.Take the vail out of its packaging and shake gently until the compounds fall to the bottom of the vial. 2. For liquid products, please centrifuge at 500xg to gather the liquid to the bottom of the vial. 3. Try to avoid loss or contamination during the experiment. |
||
| Shipping Condition | Packaging according to customer requirements(5mg, 10mg, 20mg and more). Ship via FedEx, DHL, UPS, EMS or other couriers with RT, or blue ice upon request. | ||
| Description | Used to solubilize and denature proteins. |

Urea Dilution Calculator

Urea Molarity Calculator
| 1 mg | 5 mg | 10 mg | 20 mg | 25 mg | |
| 1 mM | 16.65 mL | 83.2501 mL | 166.5002 mL | 333.0003 mL | 416.2504 mL |
| 5 mM | 3.33 mL | 16.65 mL | 33.3 mL | 66.6001 mL | 83.2501 mL |
| 10 mM | 1.665 mL | 8.325 mL | 16.65 mL | 33.3 mL | 41.625 mL |
| 50 mM | 0.333 mL | 1.665 mL | 3.33 mL | 6.66 mL | 8.325 mL |
| 100 mM | 0.1665 mL | 0.8325 mL | 1.665 mL | 3.33 mL | 4.1625 mL |
| * Note: If you are in the process of experiment, it's necessary to make the dilution ratios of the samples. The dilution data above is only for reference. Normally, it's can get a better solubility within lower of Concentrations. | |||||

Calcutta University

University of Minnesota

University of Maryland School of Medicine

University of Illinois at Chicago

The Ohio State University

University of Zurich

Harvard University

Colorado State University

Auburn University

Yale University

Worcester Polytechnic Institute

Washington State University

Stanford University

University of Leipzig

Universidade da Beira Interior

The Institute of Cancer Research

Heidelberg University

University of Amsterdam

University of Auckland

TsingHua University

The University of Michigan

Miami University

DRURY University

Jilin University

Fudan University

Wuhan University

Sun Yat-sen University

Universite de Paris

Deemed University

Auckland University

The University of Tokyo

Korea University
- Stearic Acid
Catalog No.:BCN3820
CAS No.:57-11-4
- Palmitic acid
Catalog No.:BCN1206
CAS No.:57-10-3
- Flupirtine
Catalog No.:BCC4282
CAS No.:56995-20-1
- NSC 87877
Catalog No.:BCC2468
CAS No.:56990-57-9
- U 46619
Catalog No.:BCC7207
CAS No.:56985-40-1
- Boc-Cys(tBu)-OH
Catalog No.:BCC3379
CAS No.:56976-06-8
- Gabexate mesylate
Catalog No.:BCC2096
CAS No.:56974-61-9
- 9,9'-Di-O-(E)-feruloylsecoisolariciresinol
Catalog No.:BCN1415
CAS No.:56973-66-1
- Platyphyllenone
Catalog No.:BCN5766
CAS No.:56973-65-0
- Alnusdiol
Catalog No.:BCN6503
CAS No.:56973-51-4
- Withanolide B
Catalog No.:BCN8011
CAS No.:56973-41-2
- 2'-O-Galloylmyricitrin
Catalog No.:BCN8252
CAS No.:56939-52-7
- Vincristine
Catalog No.:BCN5411
CAS No.:57-22-7
- Strychnine
Catalog No.:BCN4978
CAS No.:57-24-9
- Phenobarbital sodium salt
Catalog No.:BCC6230
CAS No.:57-30-7
- Pentobarbital sodium salt
Catalog No.:BCC6231
CAS No.:57-33-0
- Benactyzine hydrochloride
Catalog No.:BCC8841
CAS No.:57-37-4
- Phenytoin
Catalog No.:BCC5070
CAS No.:57-41-0
- Esromiotin
Catalog No.:BCC8325
CAS No.:57-47-6
- Fructose
Catalog No.:BCN4969
CAS No.:57-48-7
- Sucrose
Catalog No.:BCN5780
CAS No.:57-50-1
- Chlorotetracycline
Catalog No.:BCC8913
CAS No.:57-62-5
- Ethinyl Estradiol
Catalog No.:BCC3777
CAS No.:57-63-6
- Probenecid
Catalog No.:BCC4832
CAS No.:57-66-9
Conversion and characterization of activated carbon fiber derived from palm empty fruit bunch waste and its kinetic study on urea adsorption.[Pubmed:28384613]
J Environ Manage. 2017 Jul 15;197:199-205.
Urea removal is an important process in household wastewater purification and hemodialysis treatment. The efficiency of the Urea removal can be improved by utilizing activated carbon fiber (ACF) for effective Urea adsorption. In this study, ACF was prepared from oil palm empty fruit bunch (EFB) fiber via physicochemical activation using sulfuric acid as an activating reagent. Based on the FESEM result, ACF obtained after the carbonization and activation processes demonstrated uniform macropores with thick channel wall. ACF was found better prepared in 1.5:1 acid-to-EFB fiber ratio; where the pore size of ACF was analyzed as 1.2 nm in diameter with a predominant micropore volume of 0.39 cm(3) g(-1) and a BET surface area of 869 m(2) g(-1). The reaction kinetics of Urea adsorption by the ACF was found to follow a pseudo-second order kinetic model. The equilibrium amount of Urea adsorbed on ACF decreased from 877.907 to 134.098 mg g(-1) as the acid-to-fiber ratio increased from 0.75 to 4. During the adsorption process, the hydroxyl (OH) groups on ACF surface were ionized and became electronegatively charged due to the weak alkalinity of Urea solution, causing ionic repulsion towards partially anionic Urea. The ionic repulsion force between the electronegatively charged ACF surface and Urea molecules became stronger when more OH functional groups appeared on ACF prepared at higher acid impregnation ratio. The results implied that EFB fiber based ACF can be used as an efficient adsorbent for the Urea removal process.
Can salivary creatinine and urea levels be used to diagnose chronic kidney disease in children as accurately as serum creatinine and urea levels? A case-control study.[Pubmed:28372505]
Ren Fail. 2017 Nov;39(1):452-457.
BACKGROUND AND AIM: Children with chronic kidney disease (CKD) develop many metabolic changes in blood that often necessitate frequent biochemical analysis. Serum analysis is an invasive and painful procedure. It would be highly beneficial if a noninvasive alternative process to serum analysis in children were identified. Saliva can be collected noninvasively, repeatedly, and without the use of healthcare personnel. The aims of this study were to compare serum and salivary Urea and creatinine levels in children with CKD and healthy controls, and to determine if salivary creatinine and Urea levels can be used to diagnose CKD in children as accurately as serum creatinine and Urea levels. MATERIALS AND METHODS: This case-control study included 35 children with CKD and 28 healthy children as controls. Saliva and blood samples were collected for measurement of Urea and creatinine levels. The Urea and creatinine levels in serum and saliva in the CKD and control groups were compared using the independent samples Mann-Whitney U test. Correlations between the serum and salivary Urea and creatinine levels were determined using Pearson's correlation coefficient. Receiver operating characteristic analysis was used to assess the diagnostic performance of salivary creatinine and cutoff values were identified. RESULTS: In the CKD group, the mean salivary creatinine level was 0.45 mg/dL and the mean salivary Urea level was 0.11 mg/dL, versus 28.83 mg/dL and 21.78 mg/dL, respectively, in the control group. Stage 4 and 5 CKD patients had a mean salivary Urea level of 31.35 mg/dL, as compared to 17.78 mg/dL in the control group. Serum Urea and creatinine, and salivary creatinine were significantly higher in the CKD patients (regardless of disease stage) than in the controls (p < .05). The salivary Urea level was significantly higher in the stage 4 and 5 CKD patients than in the controls (p < .05). There was a positive correlation between serum and salivary creatinine. The area under the curve for salivary creatinine was 0.805. The cutoff value for salivary creatinine was 0.125 mg/dL, with a sensitivity of 82.9% and specificity of 78.6%. CONCLUSIONS: Based on the positive correlation between the serum and saliva creatinine levels observed in the present study, we think saliva analysis could be used as a noninvasive alternative to blood analysis for diagnosing CKD in children.
Urea Release by Intermittently Saturated Sediments from a Coastal Agricultural Landscape.[Pubmed:28380555]
J Environ Qual. 2017 Mar;46(2):302-310.
Urea-N is linked to harmful algal blooms in lakes and estuaries, and Urea-N-based fertilizers have been implicated as a source. However, the export of Urea-N-based fertilizers appears unlikely, as high concentrations of Urea-N are most commonly found in surface waters outside periods of fertilization. To evaluate possible autochthonous production of Urea-N, we monitored Urea-N released from drainage ditch sediments using mesocosms. Sediments from a cleaned (recently dredged) drainage ditch, uncleaned ditch, forested ditch, riparian wetland, and an autoclaved sand control were isolated in mesocosms and flooded for 72 h to quantify Urea-N, NH-N, and NO-N in the floodwater. Sediments were flooded with different N-amended solutions (distilled HO, 1.5 mg L NH-N, 3.0 mg L NH-N, 2.6 mg L NO-N, or 5.1 mg L NO-N) and incubated at three water temperatures (16, 21, and 27 degrees C). Urea-N concentrations in mesocosms representing uncleaned and cleaned drainage ditches were significantly greater than nonagricultural sediments and controls. While flooding sediments with N-enriched solution had no clear effect on Urea-N, warmer (27 degrees C) temperatures resulted in significantly higher Urea-N. Data collected from field ditches that were flooded by a summer rainstorm showed increases in Urea-N that mirrored the mesocosm experiment. We postulate that concentrations of Urea-N in ditches that greatly exceed environmental thresholds are mediated by biological production in sediments and release to stagnant surface water. Storm-driven Urea-N export from ditches could elevate the risk of harmful algal blooms downstream in receiving waters despite the dilution effect.
Association between an increase in blood urea nitrogen at 24 hours and worse outcomes in acute nonvariceal upper GI bleeding.[Pubmed:28377105]
Gastrointest Endosc. 2017 Dec;86(6):1022-1027.e1.
BACKGROUND AND AIMS: An increase in blood Urea nitrogen (BUN) at 24 hours is a solitary and significant predictor of mortality in patients with acute pancreatitis, which may predict worse outcomes in the similarly resuscitation-requiring condition of acute nonvariceal upper GI bleeding (UGIB). The aim of our study was to assess whether an increase in BUN at 24 hours is predictive of worse clinical outcomes in acute nonvariceal UGIB. METHODS: A retrospective cohort study including patients admitted to an academic hospital from 2004 to 2014 was conducted. An increase in BUN was defined as an increase in BUN at 24 hours of hospitalization compared with BUN at presentation. The primary outcome was a composite of inpatient death, inpatient rebleeding, need for surgical or radiologic intervention, or endoscopic reintervention. Associations between BUN change and outcomes were assessed via the Pearson chi(2) test and the Fisher exact test and via logistic regression for adjusted analyses. RESULTS: There were 357 patients included in the analysis with a mean age of 64 years; 54% were men. The mean change in BUN was -10.1 mg/dL (standard deviation, 12.7 mg/dL). Patients with an increased BUN (n = 37 [10%]) were significantly more likely to experience the composite outcome (22% vs 9%, P = .014), including an increased risk of inpatient death (8% vs 1%, P = .004), compared with patients with a decreased or unchanged BUN (n = 320 [90%]). In a logistic regression model adjusting for the AIMS65 score, an increase in BUN was independently associated with an increased risk for the composite outcome (odds ratio, 2.75; P = .026). CONCLUSION: Increasing BUN at 24 hours likely reflects under resuscitation and is a predictor of worse outcomes in patients with acute nonvariceal UGIB.


